Maximum Likelihood Estimate
Introduction
In order to understand Maximum Likelihood Estimate, we first need to understand the difference between the concept of likelihood and probability. They are related concepts but have distinct meanings and serve different purposes.
Probability
Probability is a statistical technique used to quantify the likelihood of occurrence of specific events. Its applications extend to handling randomness and making predictions across various scenarios.
Likewise, a probability distribution is a mathematical concept utilized to characterize the likelihood of different outcomes or events. It provides a comprehensive representation, detailing all possible outcomes and their corresponding probabilities.
One of the most important properties of a probability distribution is that total area under the curve is always equal to 1. i.e.
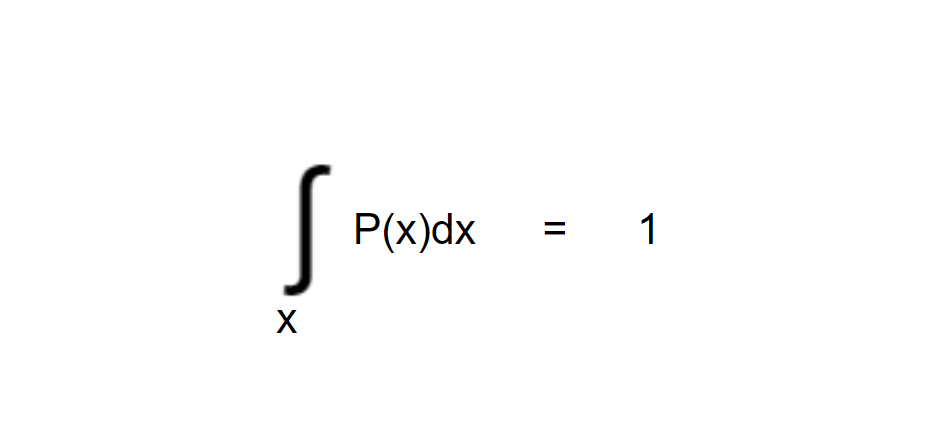
Let’s look at a normally distributed probability density distribution as shown below:
  ## Code to generate a normal distribution data
  import numpy as np
  import matplotlib.pyplot as plt

  # Generate normally distributed data
  np.random.seed(42)  # Set a seed for reproducibility
  mean_height = 170
  std_height = 5
  num_students = 100
  heights = np.random.normal(mean_height, std_height, num_students)

  # Plot the distribution
  plt.hist(heights, bins=20, density=True, color='skyblue', edgecolor='black')

  # Add labels and title
  plt.xlabel('Height')
  plt.ylabel('Density')
  plt.title('Height Distribution of Students')

  # Show the plot
  plt.show()
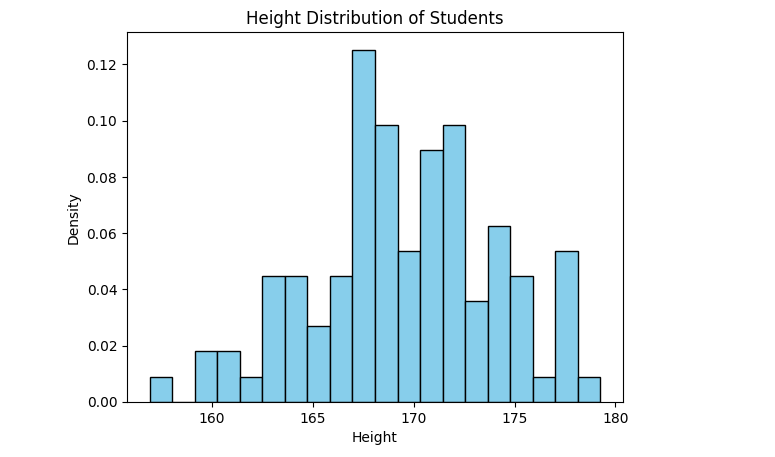
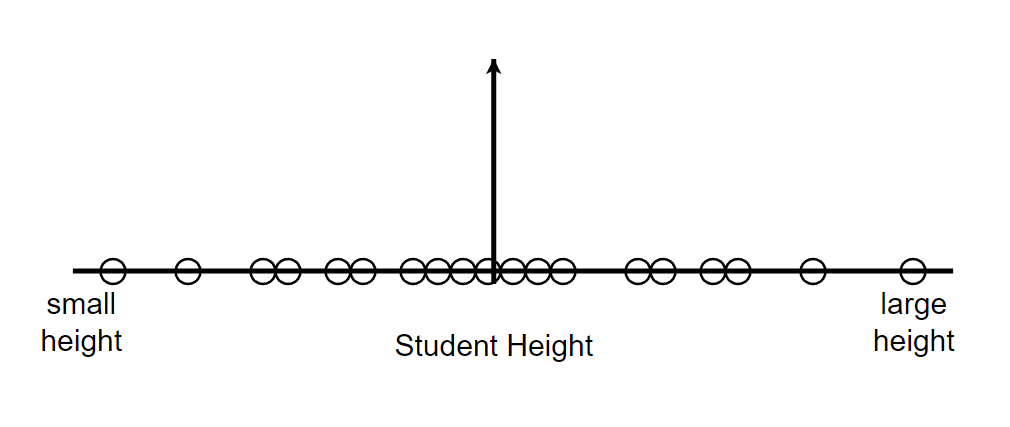
Let’s see a even simpler example to understand more about it.
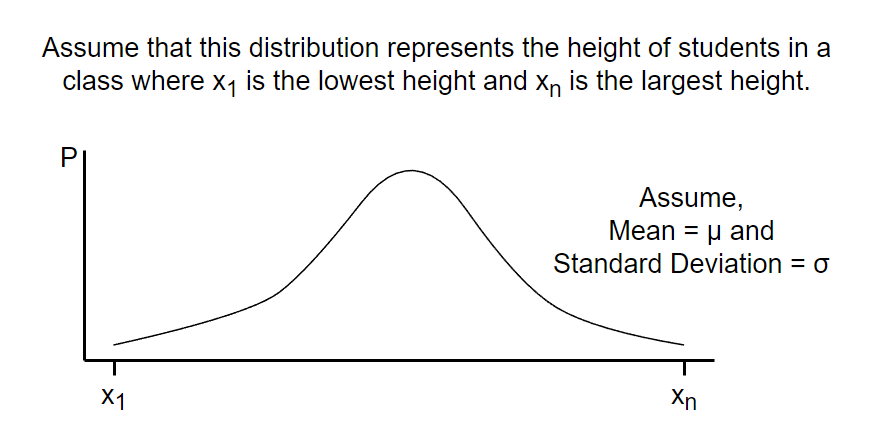
Let’s say that we randomly selected a student and measured his/her height. The probability that the height of that particular student lies between some arbitrary height interval “h1 & h2“ can be calculated as the area of the distribution from h1 to h2.
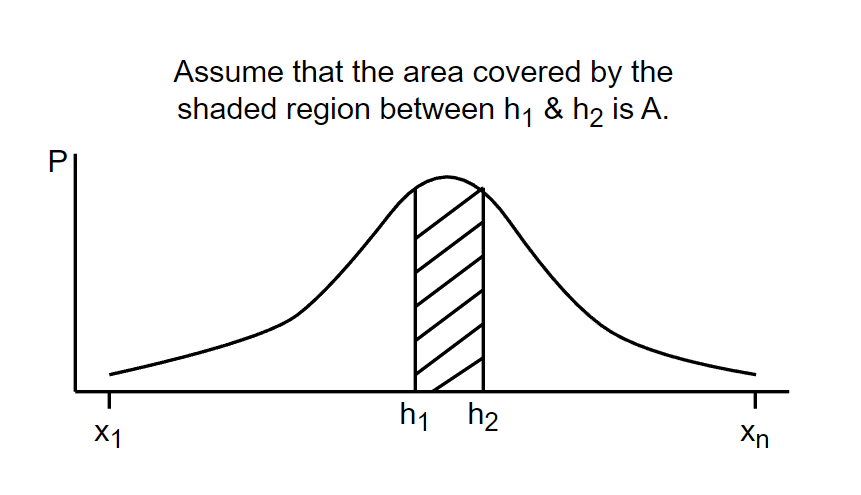
Mathematically, we can say that the probability that the height of a randomly selected student lies between interval h1 & h2 is A. i.e.
P(height of randomly selected student is between h1 & h2 | mean = μ and S.D = σ) = A
Likelihood
Imagine you have some data that you’ve observed, like the results of flipping a coin multiple times. Now, you want to know what the chances are of getting heads or tails in future coin flips. To figure that out, you use a statistical model, which has some unknown parameters (e.g., the probability of getting heads or tails).
The likelihood is like a measure of how well different parameter values (e.g., different probabilities for heads or tails) match the data you observed. It tells you how probable it is to get the exact data you observed if you assume certain parameter values.
For example, if you got 10 heads and 5 tails in your observed data, the likelihood will tell you which set of probabilities for heads and tails is more likely to have produced that result. If the model predicts a high likelihood for getting 10 heads and 5 tails with certain probabilities, those probabilities are considered more likely.
Assume, we have already calculated a students’ height and got h3. Now we can calculate the likelihood of the distribution with mean = μ and S.D = σ given that the measured height is h3.
Likelihood(Distribution with mean = μ and S.D = σ | measured height = h3) = L
The likelihood that any parameter (or set of parameters) should have any assigned value (or set of values) is proportional to the probability that if this were so, the totality of observation should be that observed. [Definition by Ronald Fisher]
Let’s understand it using a simple example:
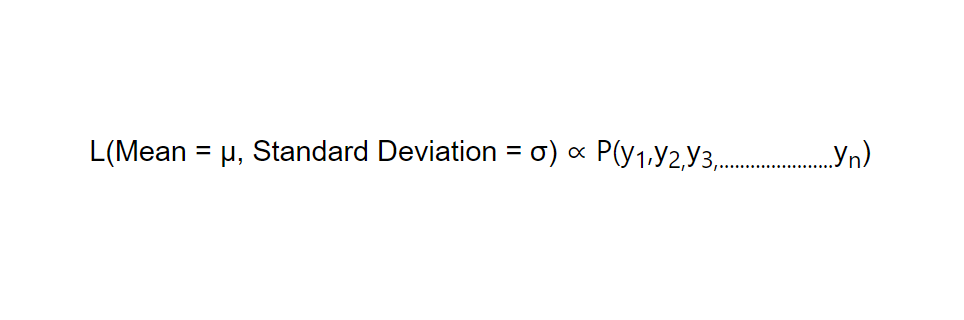
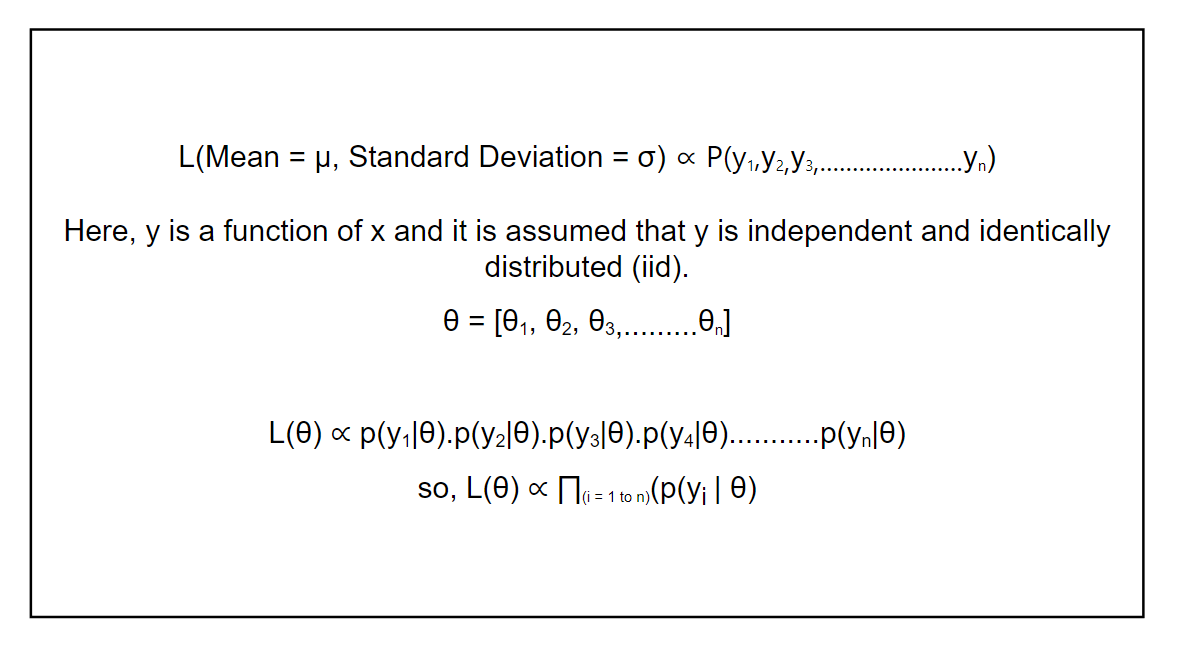
Consider a dataset of observations that are normally distributed. For this, we would like to estimate the mean and standard deviation of this distribution. By maximizing the likelihood function based on the observed data, we can obtain the MLE estimates for the mean and standard deviation.
i.e.
Take an example:
Assume that we have a model that takes input “x” and gives output “y”.
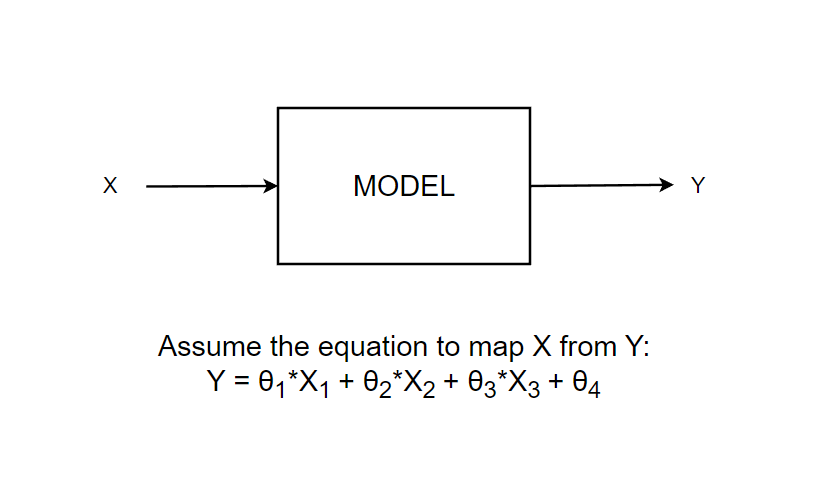
Now, we calculate the Likelihood L(θ1, θ2, θ3, θ4) = p
The estimated likelihood “p” will now quantify how well this assumed distribution with parameters θ1, θ2, θ3, θ4 is going to fit the data X.
Introduction
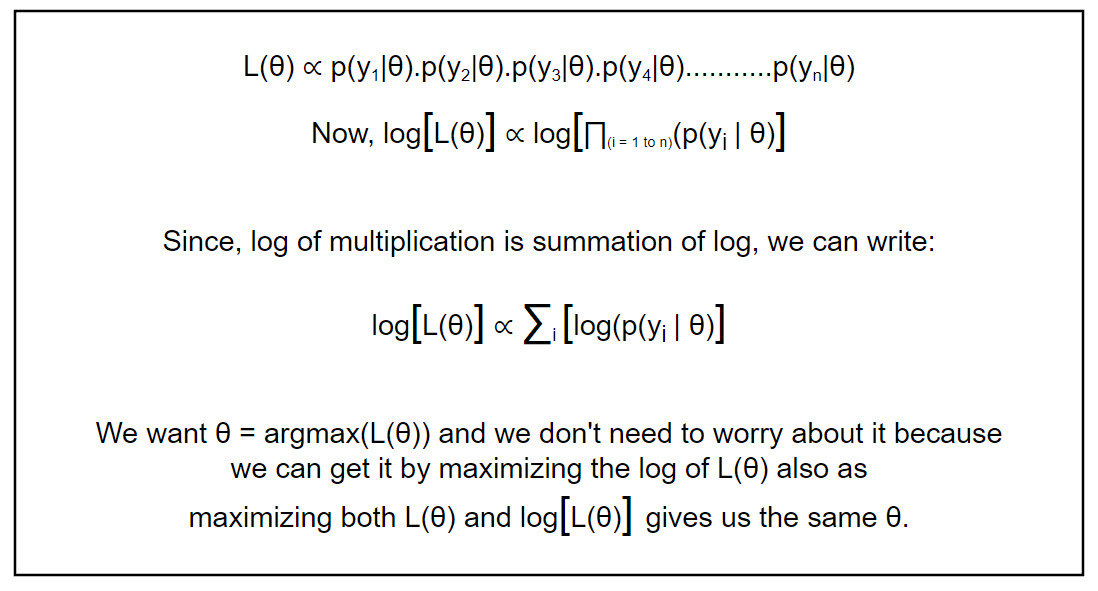
For a single example, this can be any number and by just looking at it we’ll probably be clueless on what to conclude with that specific likelihood value. So, we don’t just calculate a single likelihood. Instead, we maximize the arguments of the likelihood function. i.e, we would like to get the values of θ1, θ2, θ3 & θ4 that will give a maximum likelihood value. This is known as Maximum Likelihood Estimation or MLE.
The purpose of Maximum Likelihood Estimate is to use the data we have to make the best possible guess about something we don’t know. It’s like looking at the evidence and making an educated guess based on what we see. More technically, The central idea behind MLE is to select that parameters that make the observed data the most
likely.
But this multiplication does not seem feasible because probabilities are less than one and if we were to multiply n numbers less than one, it can lead to arithmetic underflow i.e. extremely small values that computers cannot work with. So, we introduce logarithms to both sides of the equation.
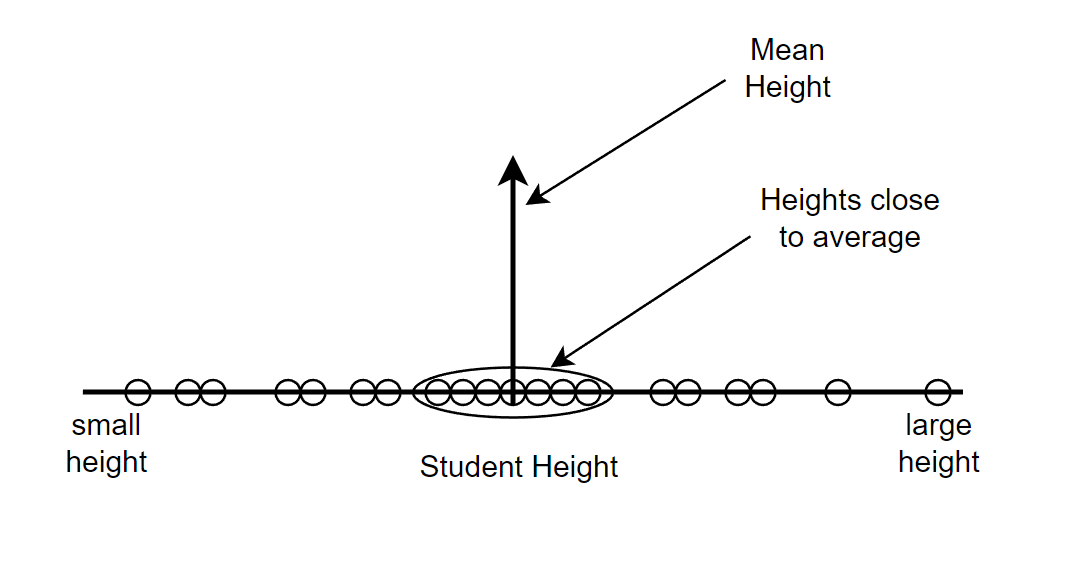
Consider a normally distributed example.Normally distributed always means few things:
1. Most of the measurements are expected to be close to mean.
2. Measurements are expected to be relatively symmetrical around the mean.
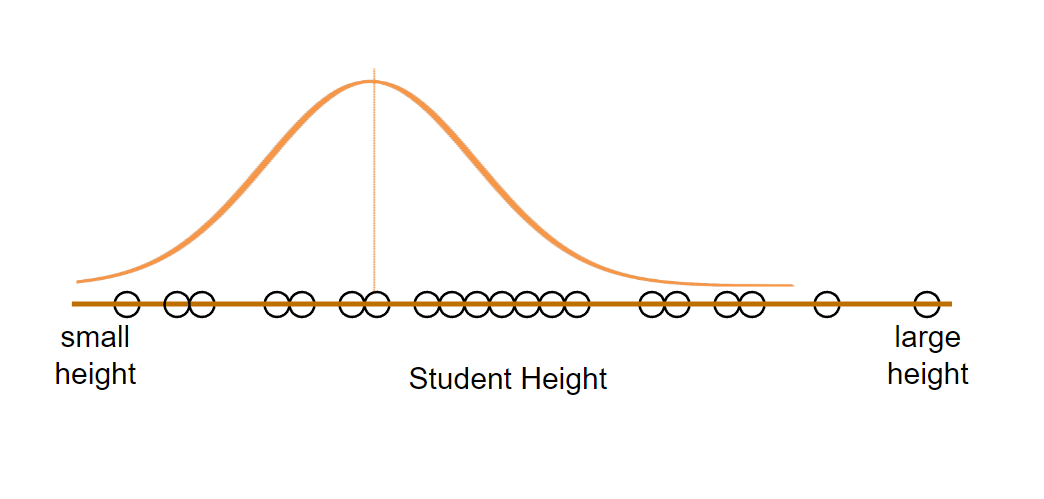
Let’s try to fit a normal distribution to this data. Even if we know a normal distribution can be fit in that particular data, we still need to find what would be the mean and standard deviation of that data. Our data can be skinny, medium or large boned in shape as shown below.
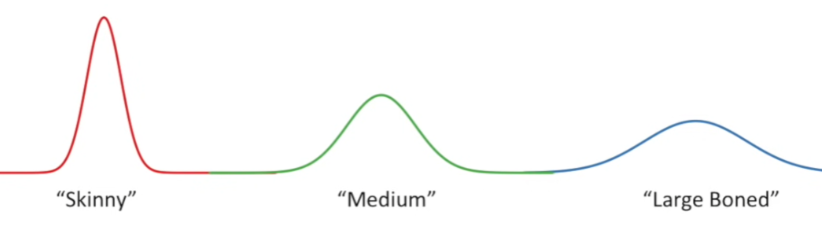
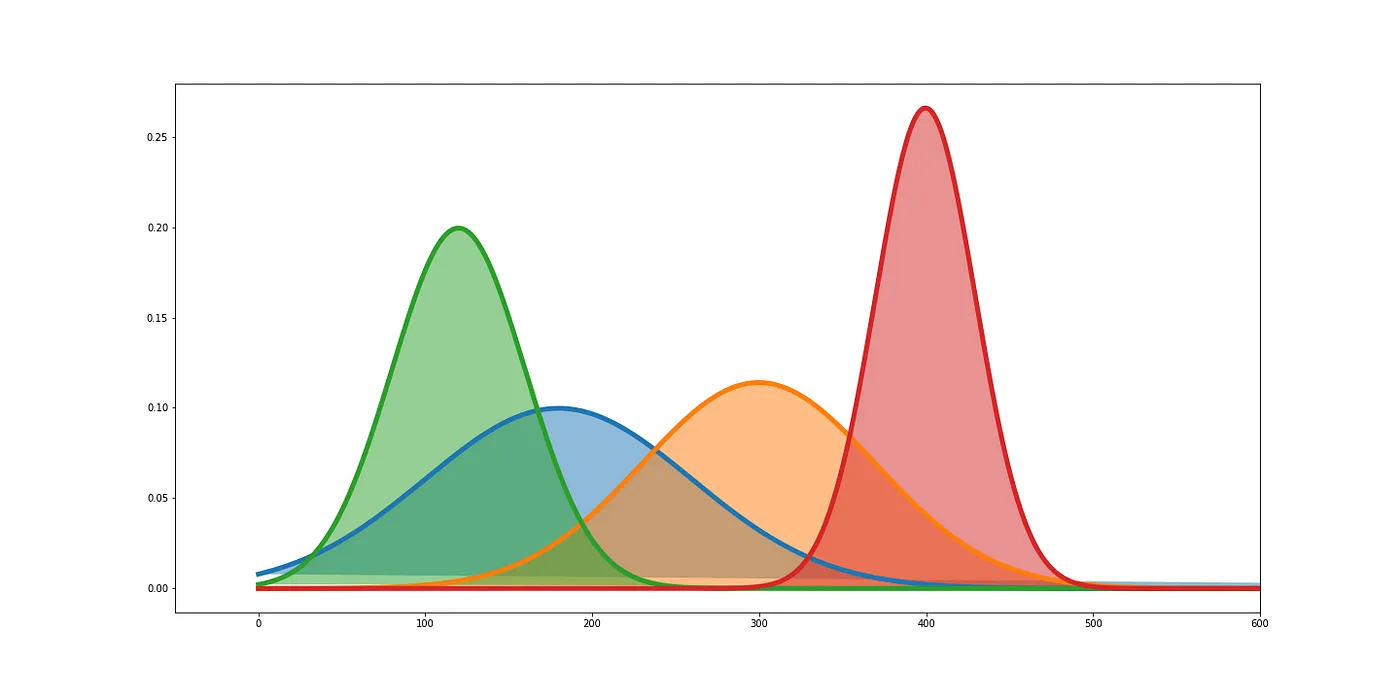
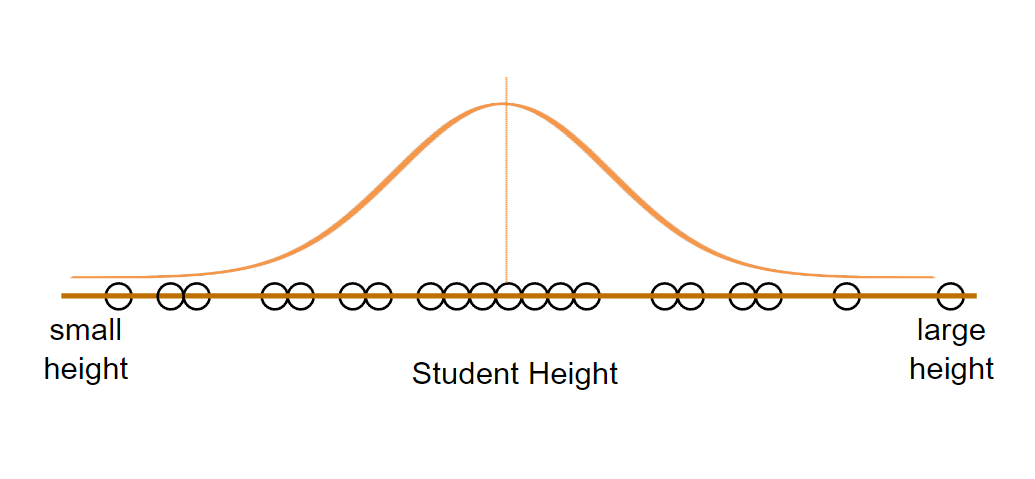
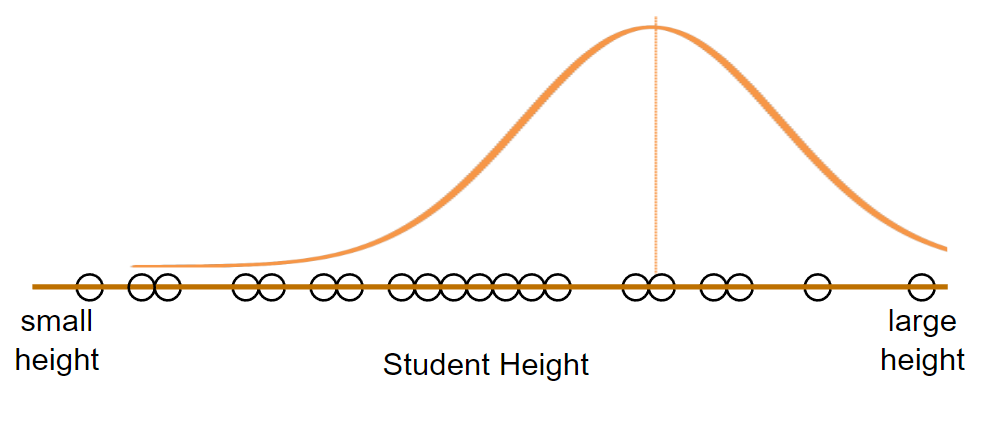
They can have any mean and standard deviation. Below are some ways we can fit normal distribution to our data.
#1 Skewed towards the left.
#2 Not Skewed.
#3 Skewed towards the right.
Like this, there can be many more possible distribution to the data. But the main focus of Maximum Likelihood Estimation is to find the distribution that maximizes the likelihood of observing all the measured data. Remember again that we are not looking for the value of likelihood that is maximum but we’re looking for parameters that gives the maximum likelihood value. Assume that the likelihood of the distribution are as shown in the figure:
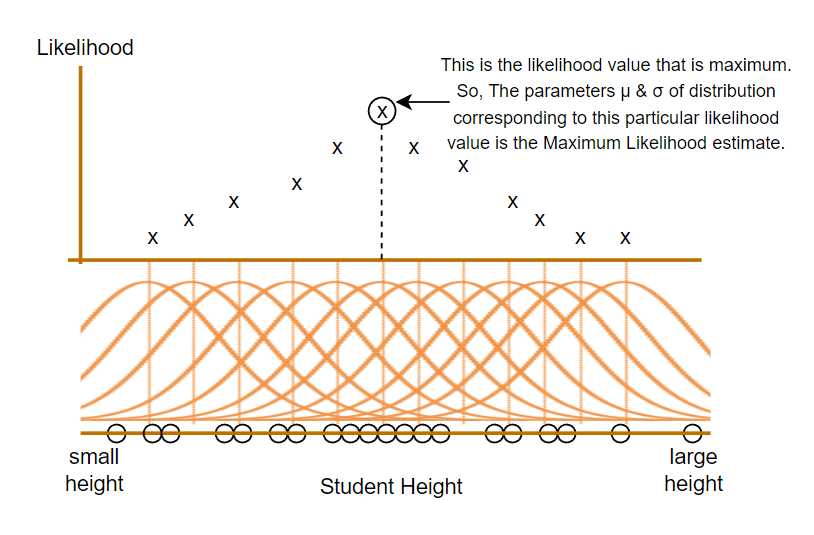
In other words, those parameters that make the measured data most likely are the maximum likelhood estimates. It is absolutely fundamental in machine learning applications as ML also includes fitting the data in best possible way. And even if we encounter other distributions, the idea of MLE is always the same.
References for this blog (Click on references for more info):
1. Probability concepts explained: Maximum likelihood estimation.
2. Likelihood Estimation - THE MATH YOU SHOULD KNOW!.
3. Probability and Statistics: Maximum Likelihood Estimation.
4. Maximum Likelihood, clearly explained!!!.
5. Maximum Likelihood Estimation -A Comprehensive Guide.